Filed record · Semiconductors
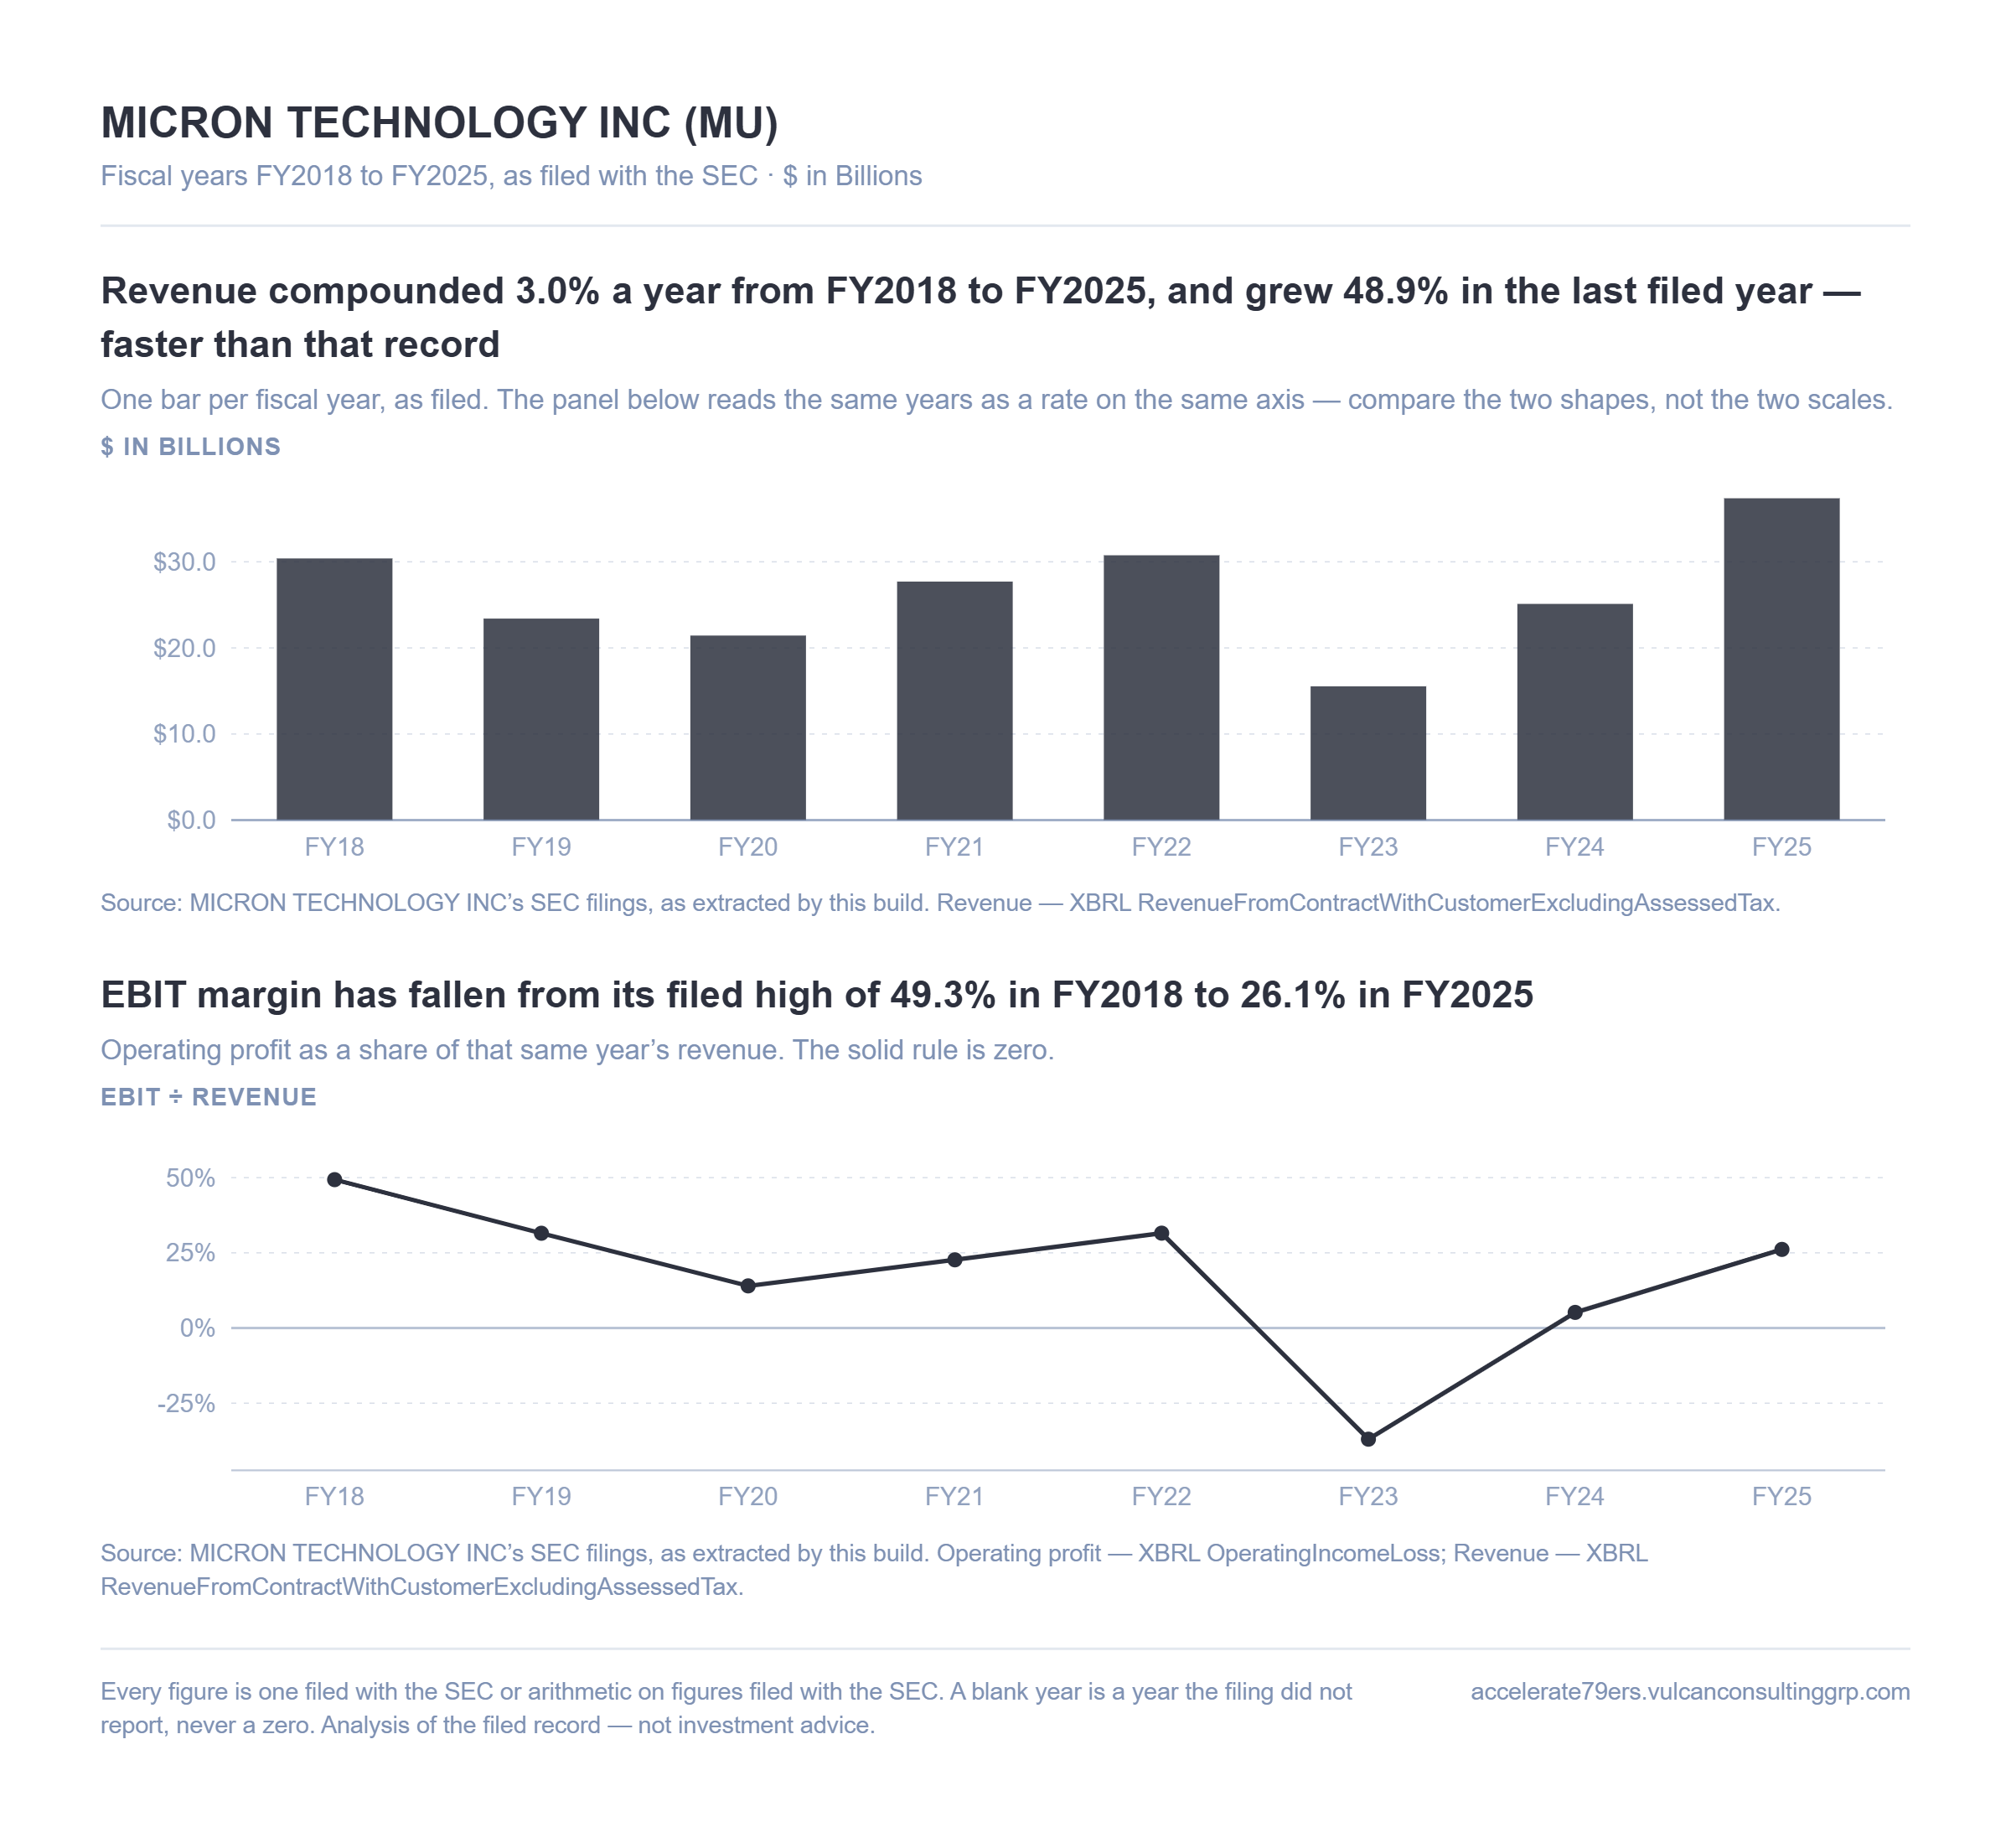
Micron grew revenue 48.9% last year. Over eight years it compounded 3.0%.
Both are true. Quote only one and you are describing a different company.
August 19, 2026 · Micron Technology (NASDAQ: MU) · FY2018–FY2025, as filed
Micron’s operating margin across the eight years on its own filings reads 49.3%, then minus 37.0%, then 26.1%. Same company, same business. On a cyclical semiconductor manufacturer, a single growth number taken from a single year does not describe the business — it describes where in the cycle you happened to look.
So this reads the record as rates rather than levels, across every year the company filed.
The top line came back. The operating line did not.
| FY2018 → FY2025 | Then | Now | Compounded |
|---|---|---|---|
| Revenue | $30.4B | $37.4B | +3.0% a year |
| Operating profit | $15.0B | $9.8B | −5.9% a year |
Operating profit compounded 8.9 percentage points a year slower than revenue. On a cyclical business the distance between those two rates is the finding: revenue is above where it started and profit is below it. The 48.9% jump in the last filed year is real, and it is a recovery off a trough rather than a return to where the record began.
What it costs to stay in the game
Across the eight years both lines were filed, Micron spent 38.2% of revenue on capital expenditure against a depreciation charge of 25.1% — roughly 1.5× the rate its own assets were being consumed. In FY2025 that ran 42.4% against 22.3%.
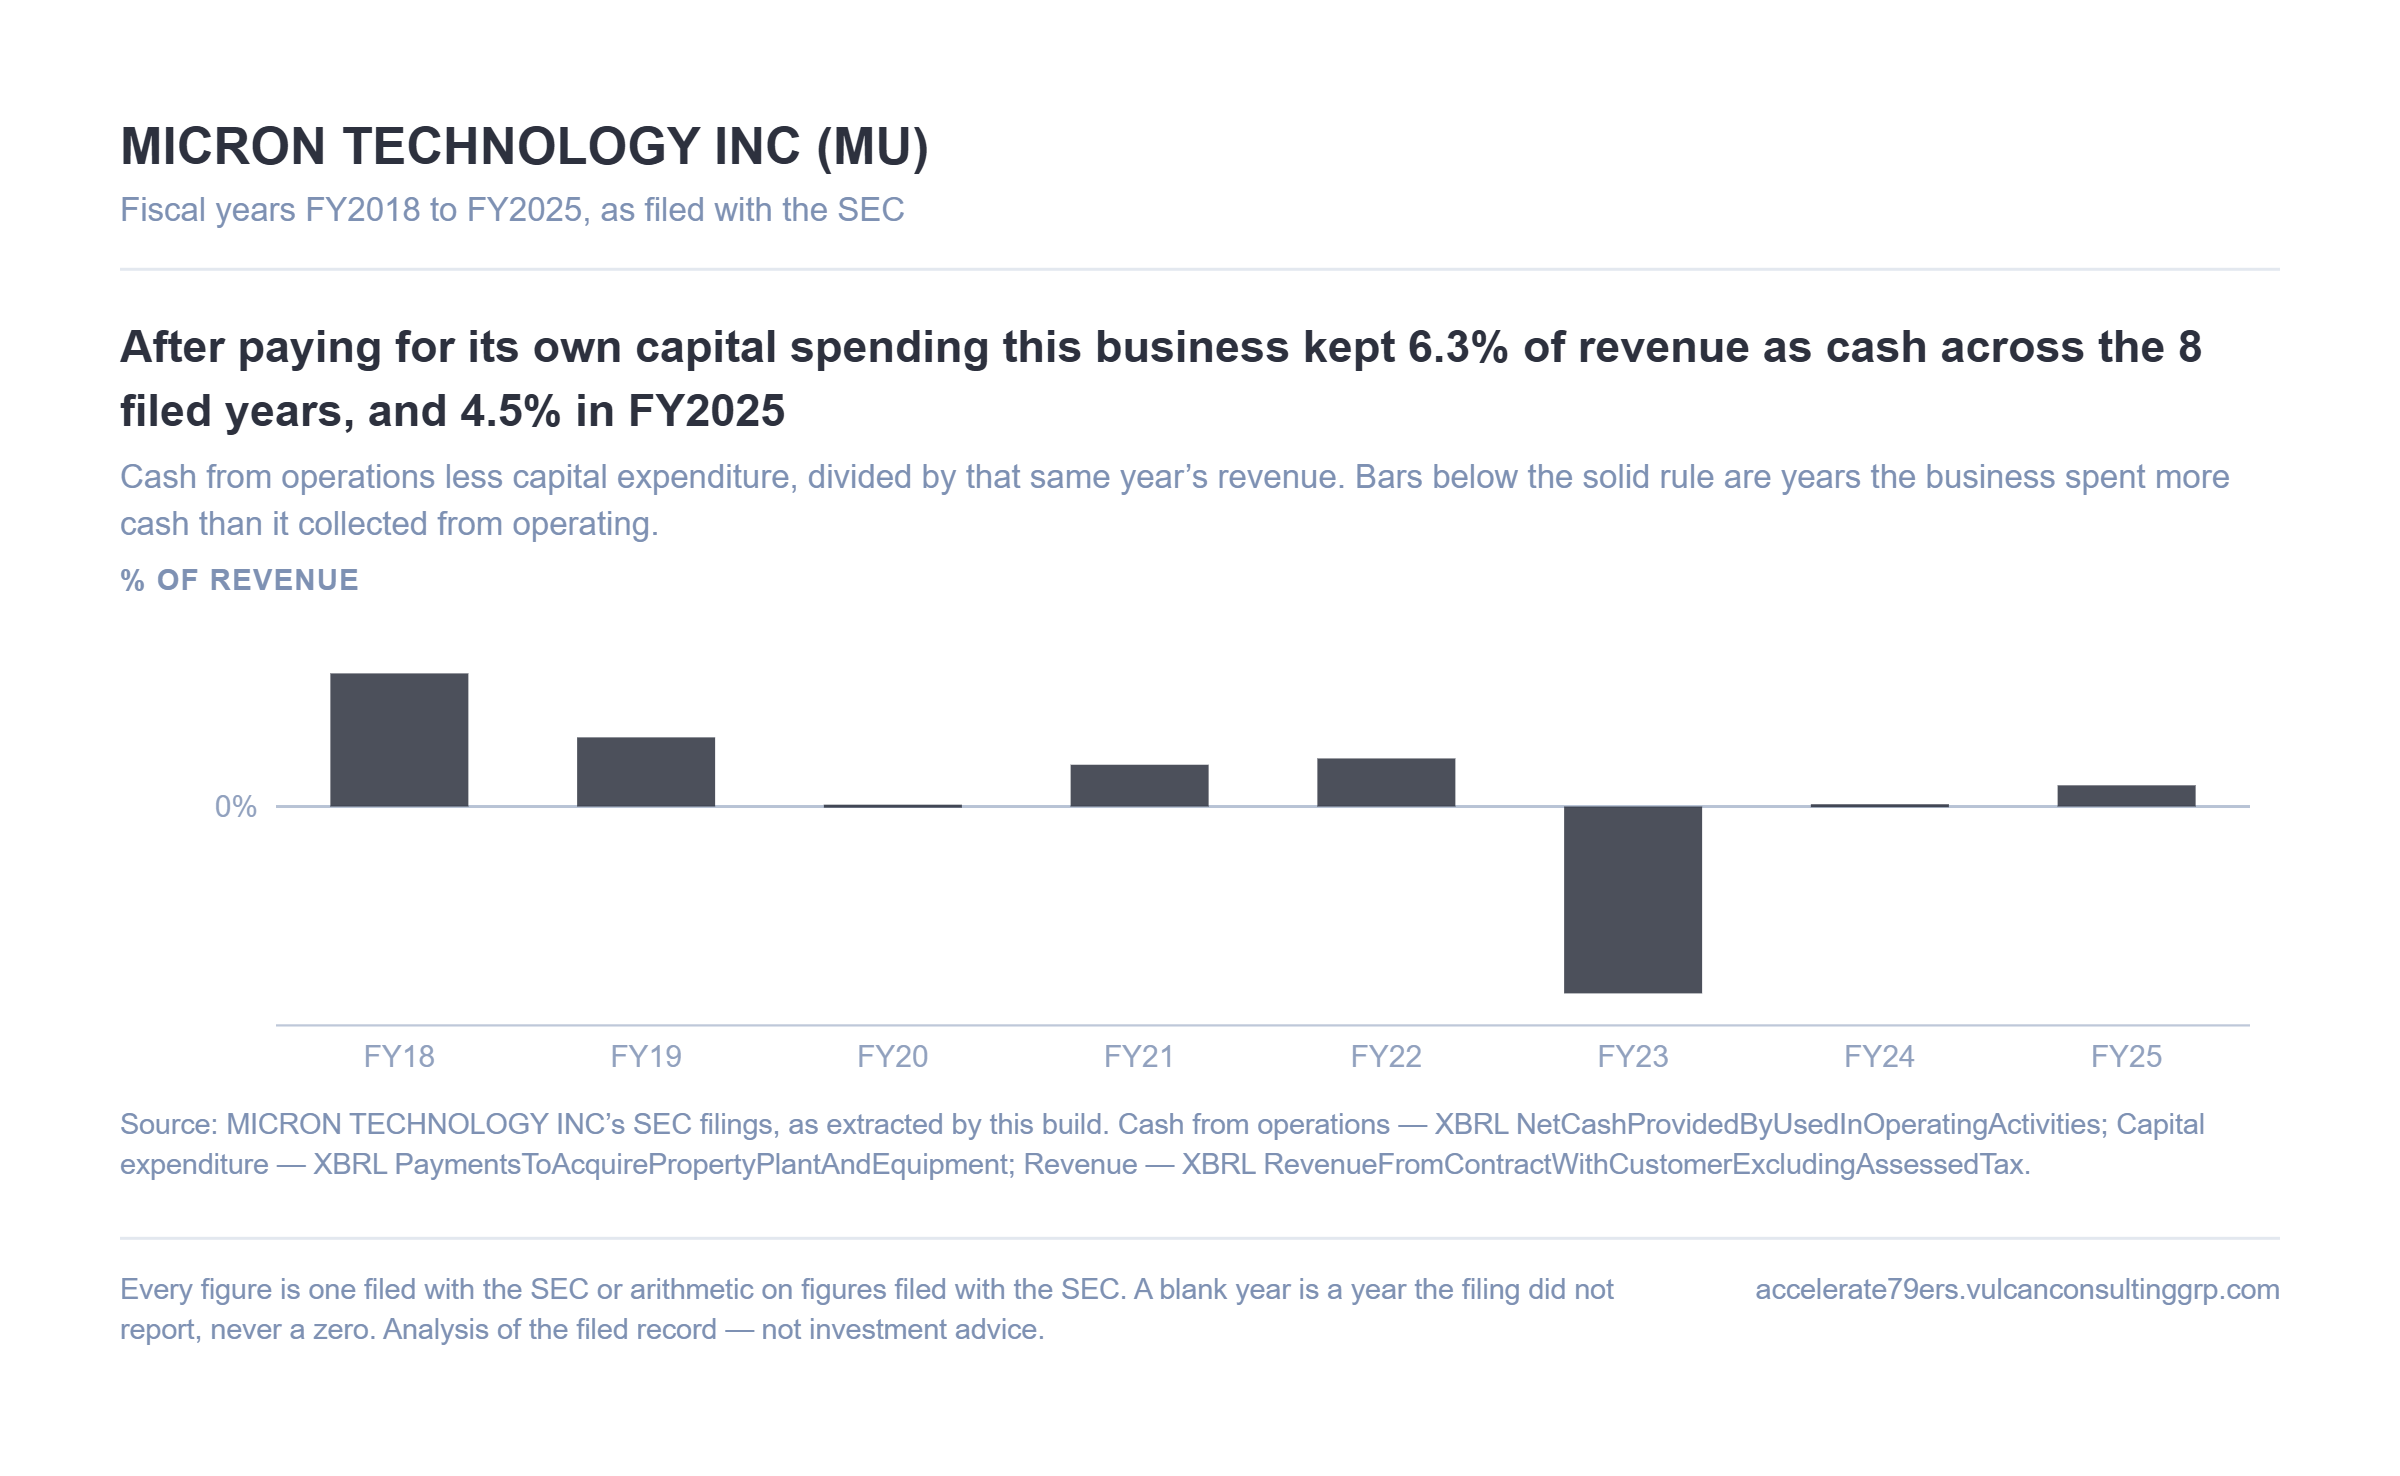
After paying for that spending, the business kept 6.3% of each revenue dollar as cash across the span, and 4.5% in FY2025. One of the eight years was negative.
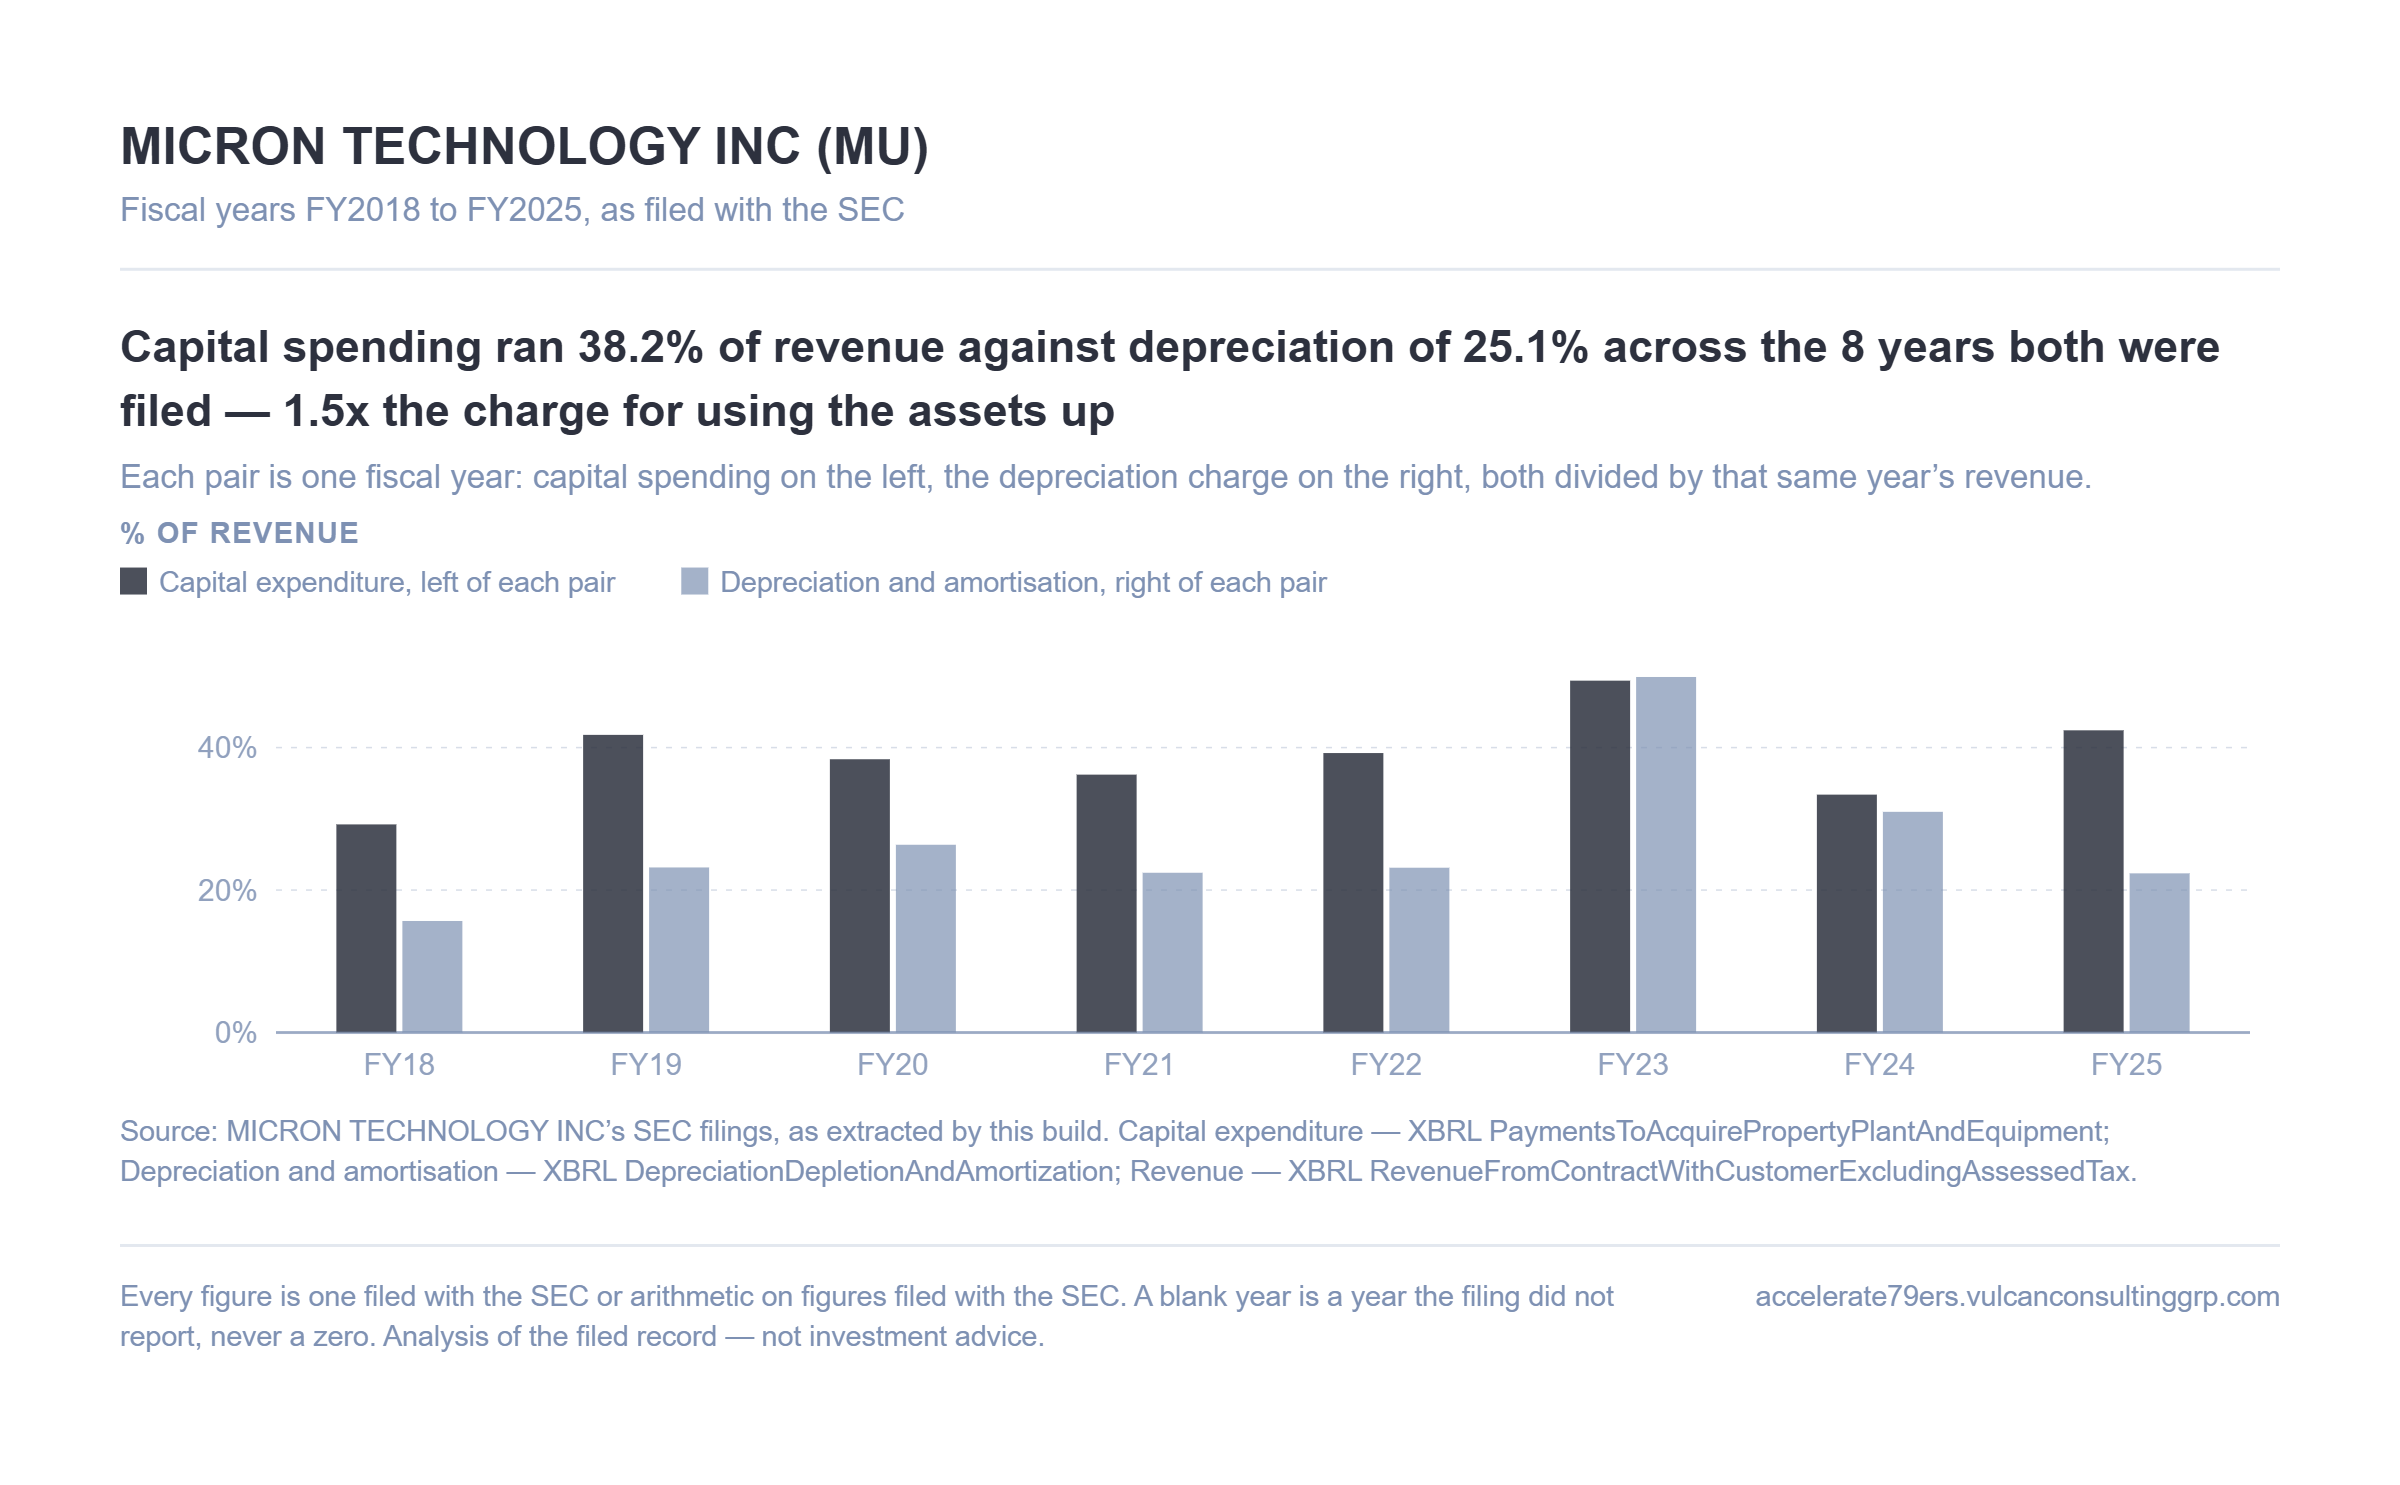
The memory cycle in three numbers. Capital spending at 1.5× the depreciation charge, 6.3% of revenue surviving it, and one year in eight where nothing survived at all.
You spend through the trough to have capacity at the peak, and the peak is what pays for the trough.
What this record supports, and what it does not
It supports a statement about direction and pace over FY2018–FY2025, about which of the two lines moved, and about the rates they compounded at.
It does not support a statement about whether that pace is good. The only baseline here is Micron against its own history, so nothing above says how it compares with a peer, an industry, or an expectation set outside the filings. It also cannot say why any line moved — a cause has to come from the filing text, not from these figures.
There is no projection here, and no target price.
Method. Every figure is read from Micron Technology’s Form 10-K filings on SEC EDGAR and matched by US-GAAP tag rather than by printed row label. Multi-year figures are the sum of the numerators divided by the sum of the denominators, which is not the average of the yearly rates. A year the company did not report an input is left blank, never zero. Per-share figures, where shown, are restated onto the most recent filing’s share basis so a stock split does not break the series.
Produced with Accelerate 79ers. This is analysis of what was filed, not investment advice. Vulcan Consulting Group is not a registered investment adviser and makes no recommendation.