
A Research Database of What Companies Filed

What the filings actually say.

For analysts and individual investors who want to judge a company from its filings rather than a summary of them. We read the 10-Ks and measure the record—eight years of growth, margin, cash kept after capital spending, and reinvestment, in one place. Every figure names the filing line it came from. No terminal required.

Free to start · Sign in with Google · No card required

Covering US filers on SEC EDGAR and Indian filers on BSE/NSE.

Your data stays yours We never sell your personal or financial data. Filings we retrieve are used solely to deliver your analysis.
Encrypted and access-controlled HTTPS/TLS in transit, Google OAuth 2.0 authentication, and role-based access controls.
Every figure is traceable Each extracted number links back to the page it came from, so any output can be audited against the filing.
Analysis, not advice Outputs are tools for your own analysis. We are not a registered investment adviser and do not make recommendations.

Full detail in our Privacy Policy and Terms of Service.

The hard part isn’t finding the numbers.

A 10-K reports three years, so a decade is stitched from four of them—and they quietly disagree. A company that split its stock reads as three different companies. A line the filer stopped reporting turns into a zero. Knowing which figures can honestly sit next to each other is the work. That is the part we do.

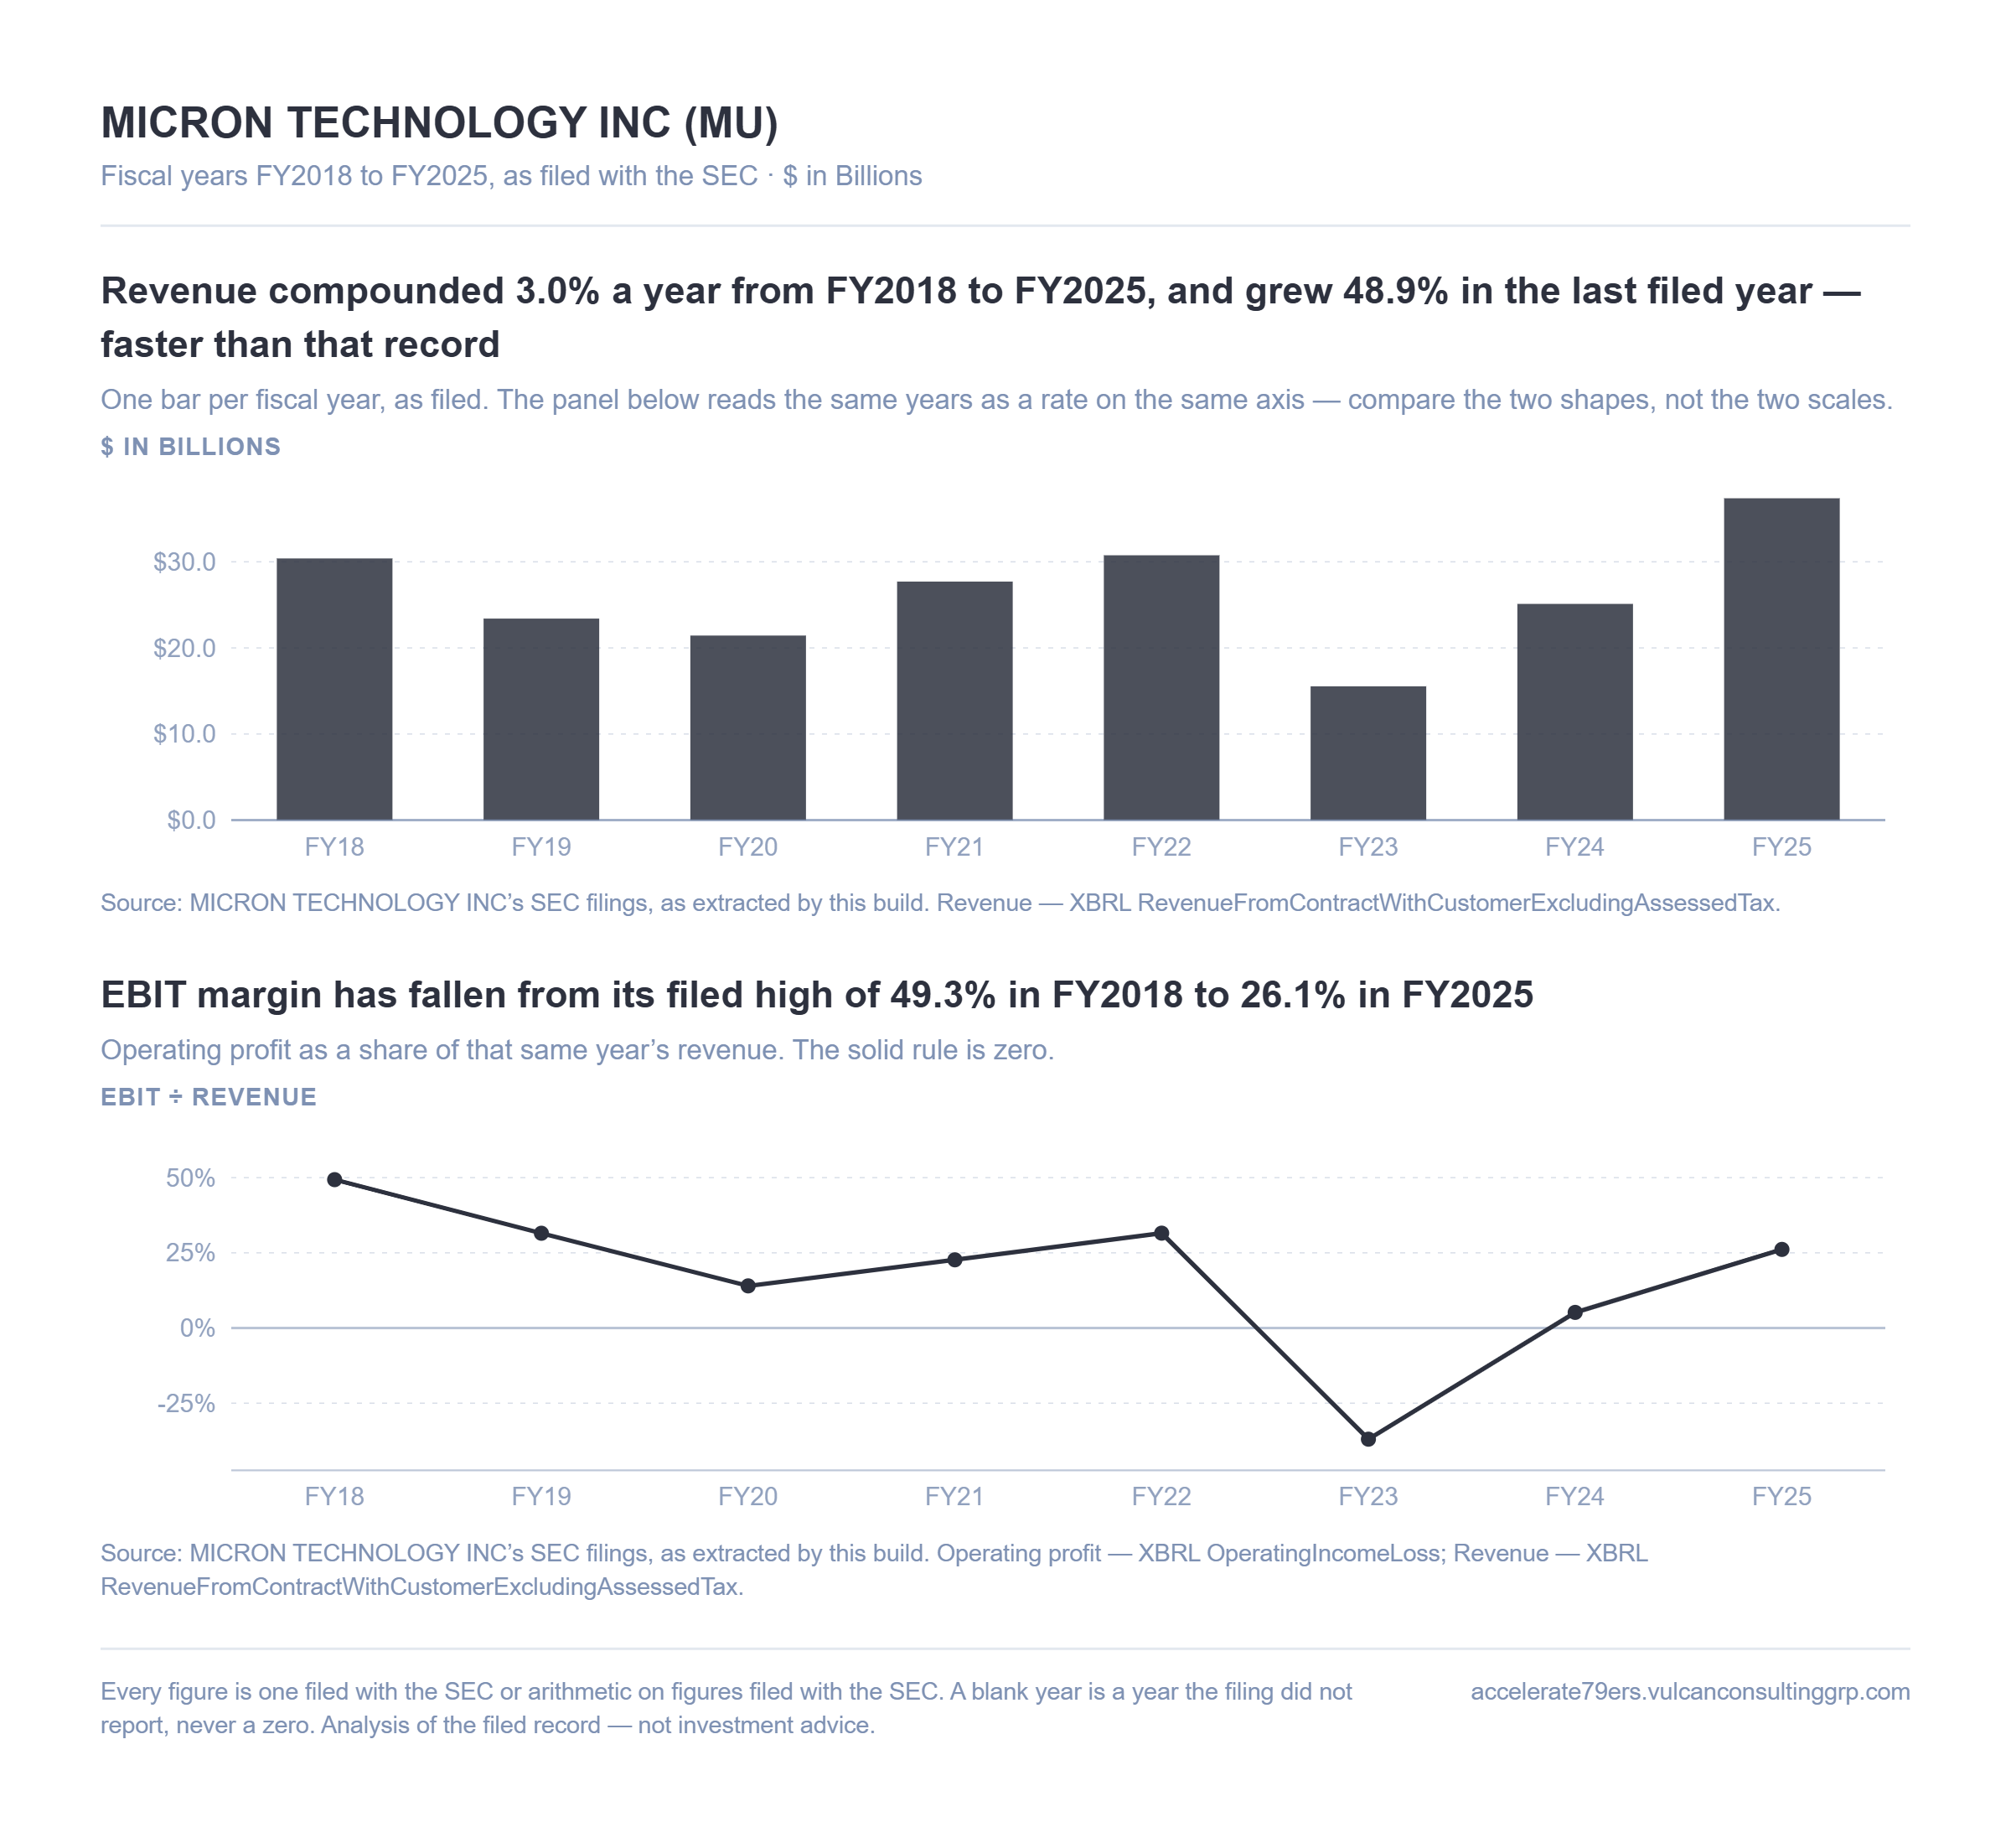
Micron Technology revenue and operating margin, fiscal years 2018 to 2025, read from its SEC filings
Micron Technology, FY2018–FY2025, as filed. Revenue compounded 3.0% a year while operating profit compounded −5.9%. Exported straight from the product—the line naming every XBRL tag is part of the image.

Built to be checked

Read from the filings themselves, and checkable line by line.

60 min → 4 min
93% time reduction on US filing analysis
95% extraction accuracy
Across 75+ US public companies
20 health measures
Computed for every filed year, each naming its source line
Every figure sourced
Filing line and XBRL tag, on every number

A company’s filed record, read and measured—for US and Indian equity markets.

The Filed Record

Eight years, as reported

  • Revenue and operating profit, each with the rate it compounded at—so a company whose sales grew while its profit shrank reads as two different numbers, not one average
  • Margin against its own filed high and low, cash kept after the company’s own capital spending, and reinvestment against the depreciation charge
  • Every panel states what it supports and what it does not—a record that cannot answer a question says so
Business Health Measures

Twenty measures, every filed year

  • 75+ US public companies read straight from SEC EDGAR—95% extraction accuracy, 93% time reduction (60 min → 4 min)
  • Return on equity split into margin, asset turnover and leverage—and reconciled back to it in every filed year, so the decomposition is checked rather than asserted
  • The cash conversion cycle broken into its terms: days tied up in inventory and receivables against days funded by suppliers and customers
  • Measures the filings cannot support are named with the reason, never filled with a zero

Traceable by Construction

Ask the record, get a sourced answer

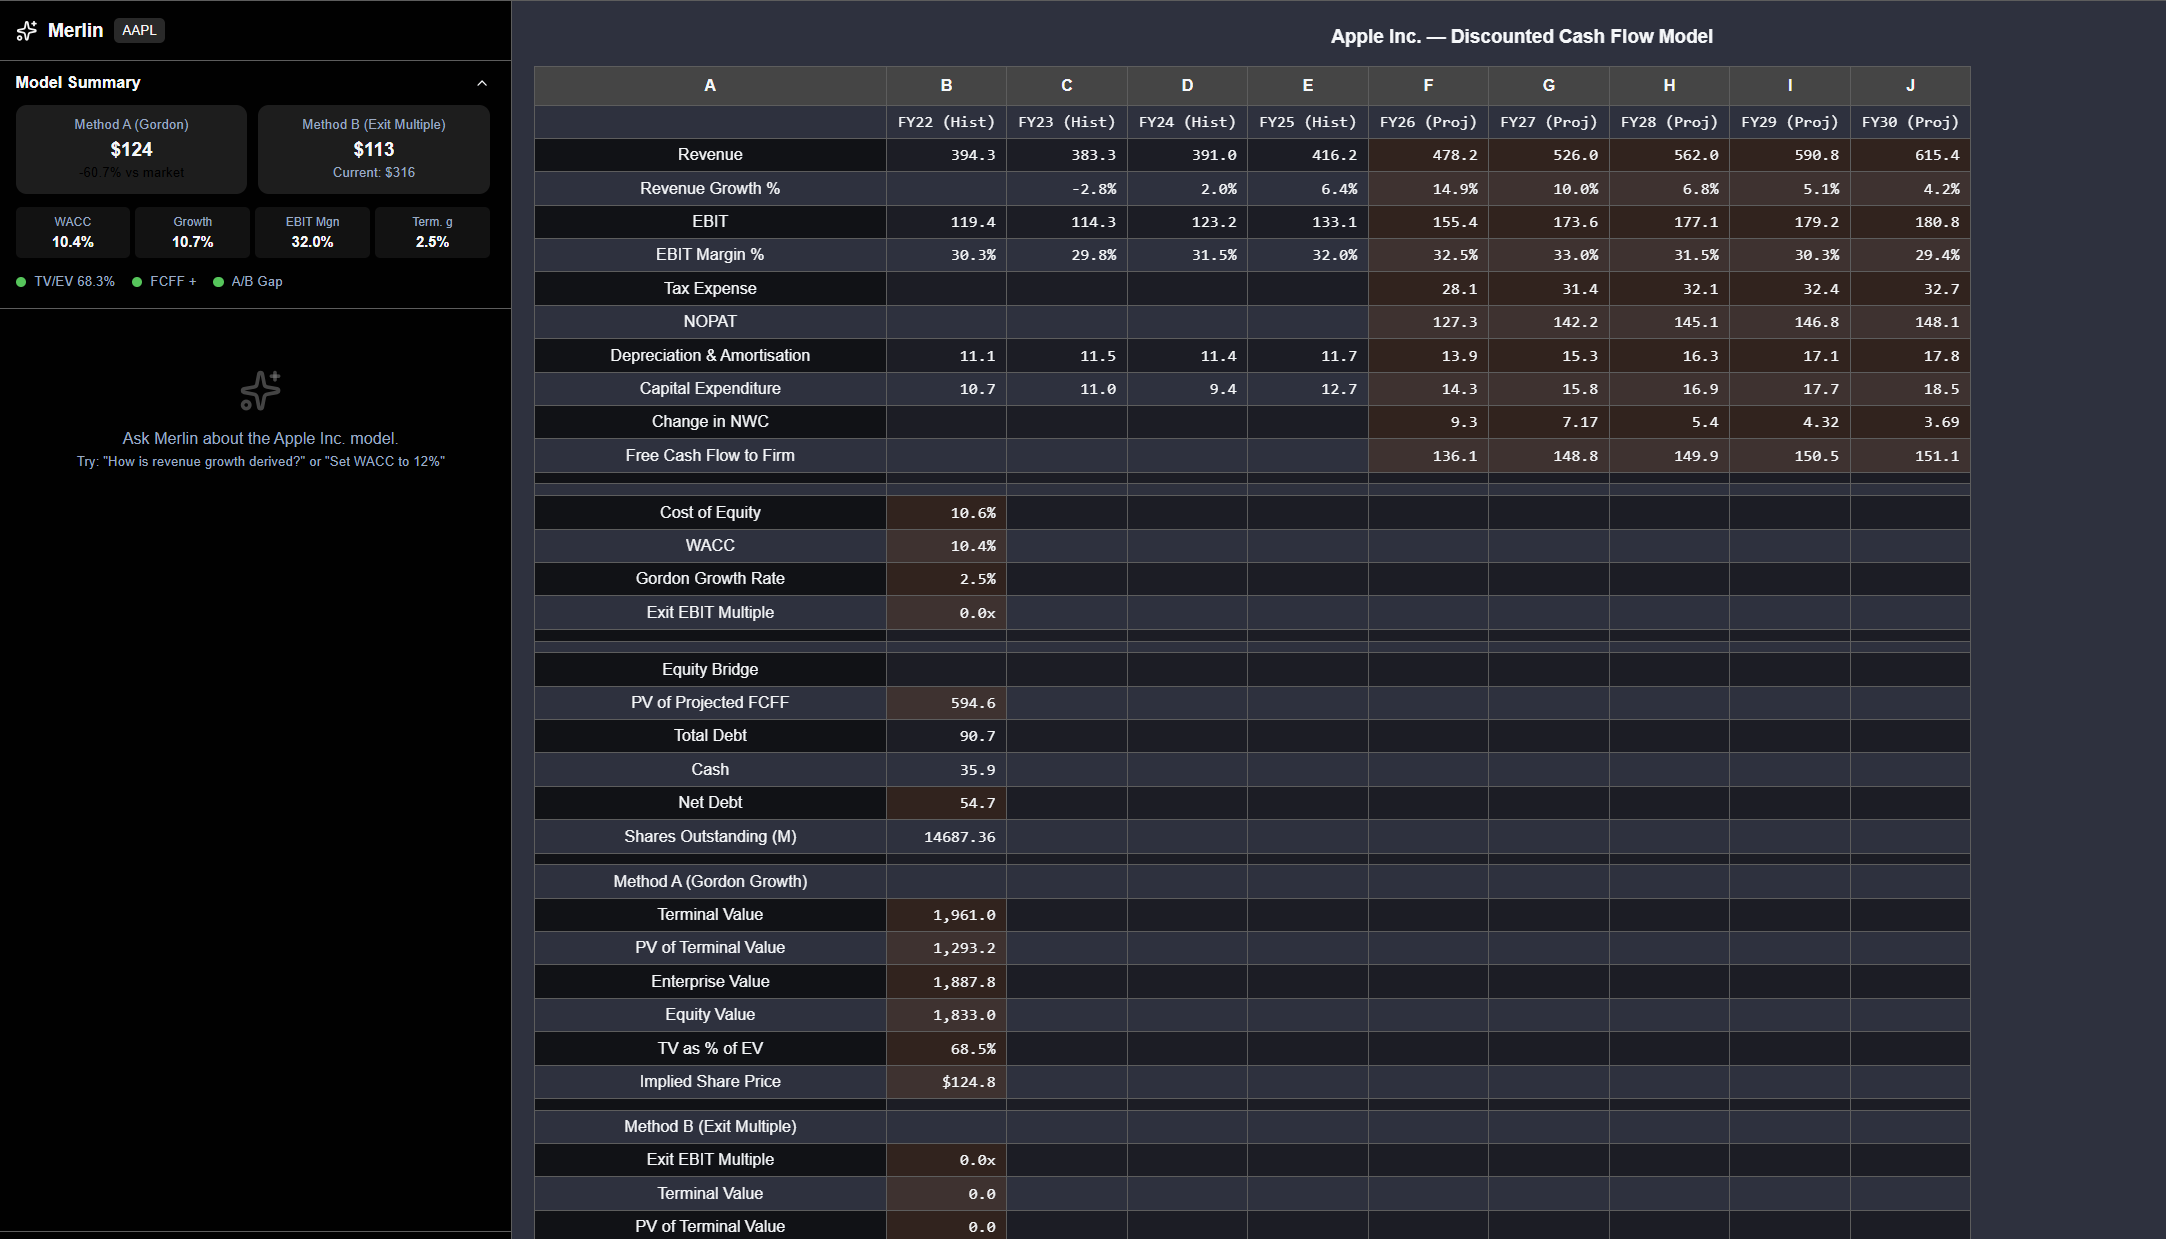
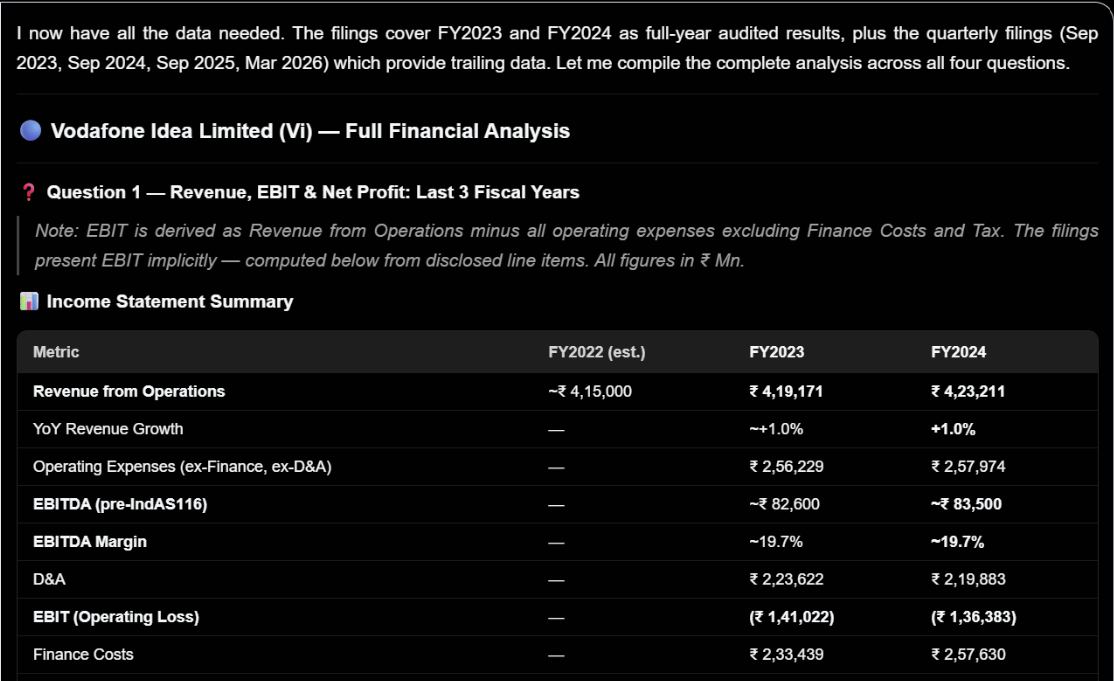
  • Ask Merlin—the built-in analyst—about any company’s filings, and get the statement line behind the answer
  • Per-share figures restated onto one share basis, so a company that split twice still reads as one continuous series instead of three
  • A year a company did not report is blank, never zero—and any chart can be saved as an exhibit with its title, axis and source line intact

Why not just use Bloomberg or ChatGPT?

Bloomberg

$25,000+/seat/year. Gives you the data — you still do the reading.

ChatGPT

Summarizes filings. Can’t tell you which line it read.

Accelerate 79ers

US and Indian filings in one place. Measures the record, and names the line behind every figure.

Who it's for

Two people, one job: work out how a business is actually doing from what it filed—without paying for a terminal to do it.

For Analysts
You already read 10-Ks. Type a ticker and the history is assembled for you—eight years of growth, margin and cash on one screen, each figure carrying the line and tag it came from, so you can check any of it in seconds.
For Retail Investors
The reading a professional would do, without the $25,000 terminal or the finance degree. Every claim on screen says which filing line it came from, and says plainly what the record cannot tell you.

About Vulcan Consulting Group

Vulcan was founded to close the gap between what a company files and what an investor can actually read. We build tools that measure the filed record and show their working—every figure traceable to the line it came from.

Get In Touch

Drop your email and we'll show you how Accelerate 79ers can work for you.